> For the complete documentation index, see [llms.txt](https://doc.commandersact.com/llms.txt). Markdown versions of documentation pages are available by appending `.md` to page URLs; this page is available as [Markdown](https://doc.commandersact.com/features/consent-management/user-guides/consent-analysis.md).
# Consent Analysis
The Commanders Act **Consent Analysis Dashboard** provides a centralized view of your compliance health and user engagement. It combines high level visual modules with deep analytical metrics to help you optimize your consent rates and tracking quality.
## Visual Analysis Modules
The dashboard is organized into specialized widgets to provide immediate insights without digging into raw tables.
### 1. Executive KPI Cards
These cards provide a weighted average of your selected banners and include **Period over Period (PoP)** comparisons.
* **Global Consent Rate:** Total percentage of visitors exposed to the CMP who accepted at least one category. This metric includes all exposed traffic and can therefore be impacted by human bounces and ghost traffic.
* **Interaction Rate:** Percentage of visitors exposed to the CMP who actively engaged with the banner, for example by accepting, rejecting, or opening or saving the Privacy Center.
* **Explicit Consent (Trust Metric):** Percentage of visitors who explicitly consented among visitors who actually interacted with the CMP. Because it excludes exposed visitors who never interact, this is the most accurate indicator of banner performance and brand trust.
* **Estimated Tracking Loss:** Estimated share of exposed traffic that cannot be tracked in practice because no usable consent outcome is available. It mainly corresponds to **Explicit Refusals** plus **No Choice**. These two components are shown separately because they reflect different situations and different optimization levers.
### 2. Decision Journey (Funnel)
The Funnel widget visualizes the conversion path to identify where drop offs occur:
1. **Exposure:** Total visitors who saw a CMP banner.
2. **Interaction:** Visitors who engaged with a button, link, or Privacy Center.
3. **Opt ins:** Final volume of visitors who provided a positive consent.
### 3. Strategic Insights
The dashboard automatically interprets data to highlight the most relevant reading points and growth levers.
### 4. Segmentation & Compliance
* **Geographic Impact:** Segments performance between **Europe (GDPR)** and the **Rest of the World**.
* **Consent by Device:** Compares Desktop, Mobile, and Tablet performance.
* **Real time Cookie Scanner:** A live audit of your compliance health. It displays your **Compliance Score**, detected **Violations** such as cookies dropped before consent, and **New Cookies** discovered.
***
## Interface & Controls
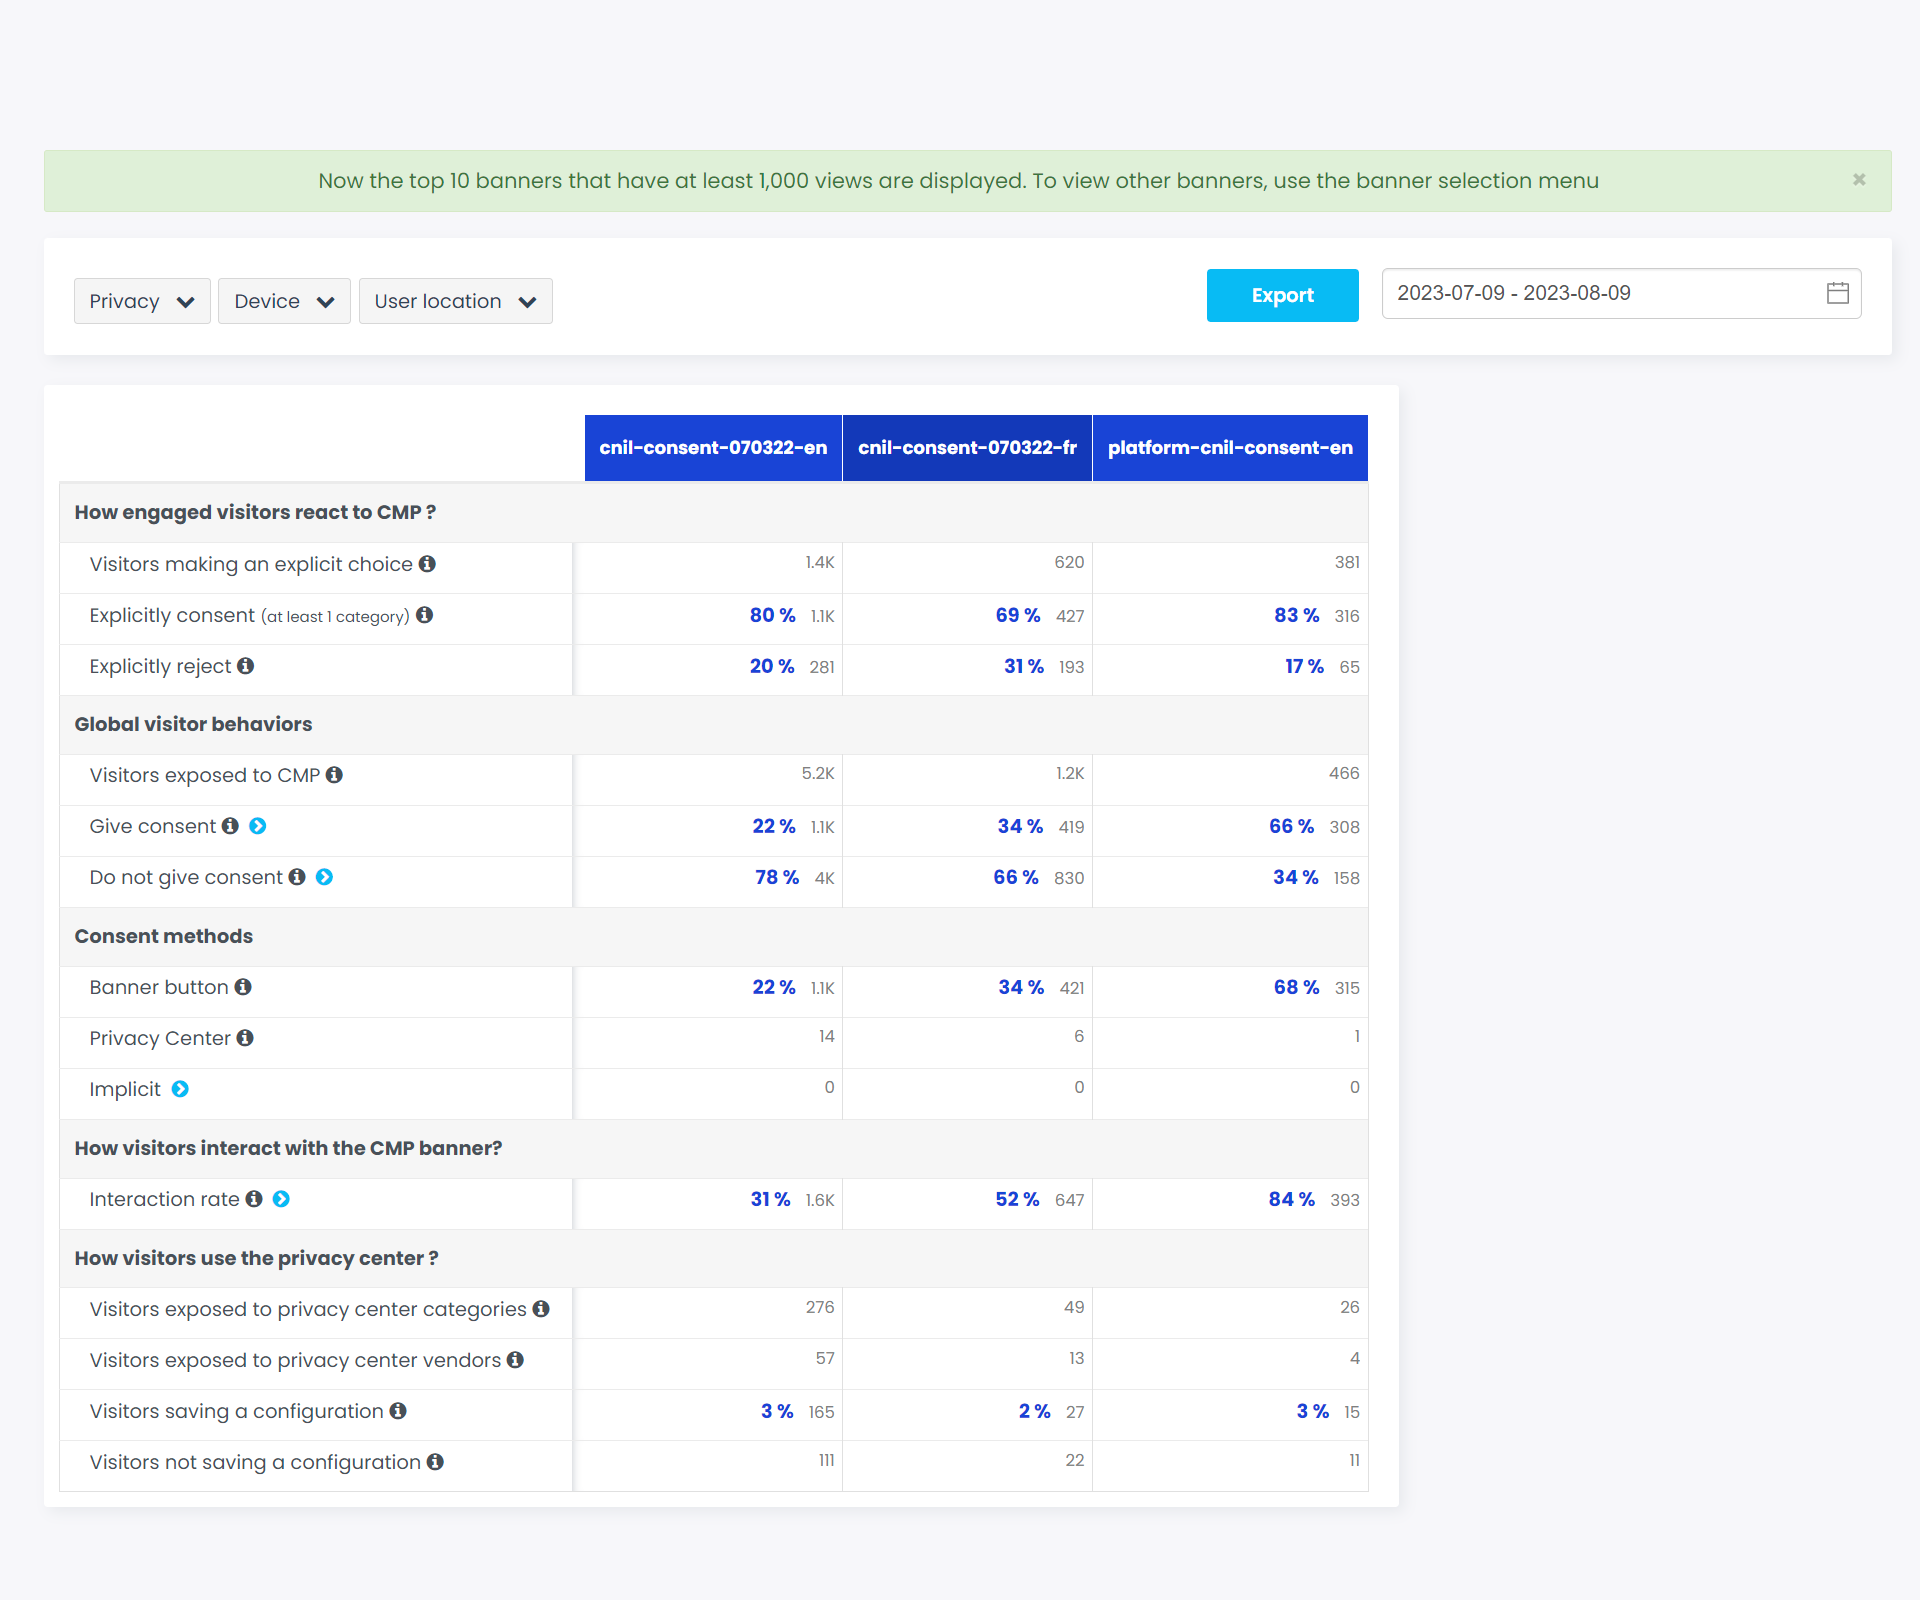
### Filter Options
You can customize the dashboard by adjusting filter settings at the top left. By default, the top 10 banners that have at least 1,000 views are displayed.
{% tabs %}
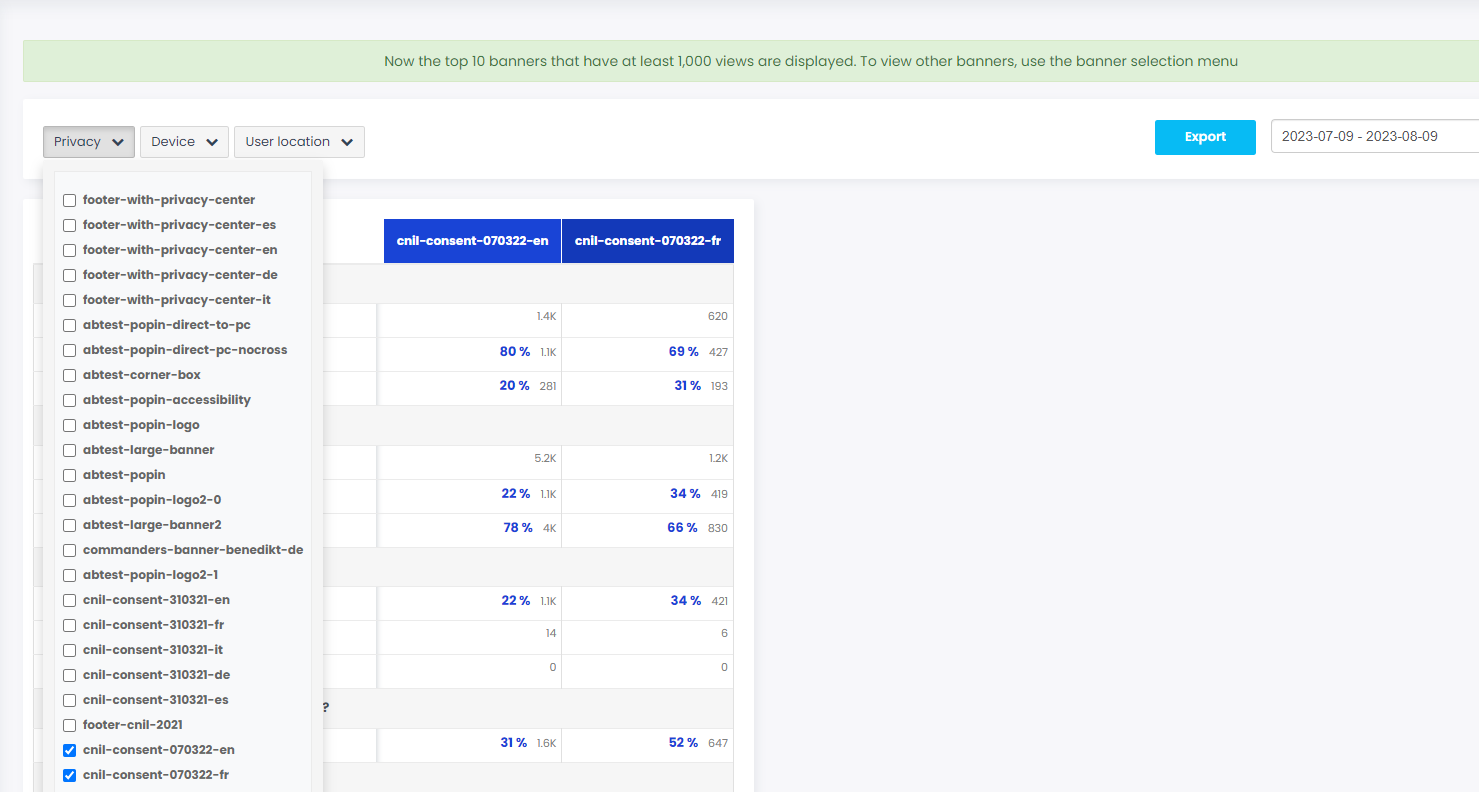
{% tab title="PRIVACY" %}
Configures which privacy banners are displayed in the dashboard modules and table.
{% endtab %}
{% tab title="DEVICE" %}
Allows filtering dashboard metrics by typical device types. Depending on the browser settings of your website visitors, device recognition may not be 100% accurate.
{% endtab %}
{% tab title="USER LOCATION" %}
Allows filtering dashboard metrics for data inside and outside the EU.
{% endtab %}
{% endtabs %}
Filter interface
### Time Selection & Trends
On the top right, specify a date range. The dashboard displays **Trends** as green or red percentages comparing the selected period to the immediately previous period of equal length.
Example: if you select February 10 to February 15, the comparison is made against February 4 to February 9.
{% hint style="info" %}
To select only one day, click the same day twice in the date picker so that both the start and end date are identical.
{% endhint %}
### Export Options
Export CSV reports via the **EXPORT** button.
{% hint style="warning" %}
Data collection is real time, but advanced metrics calculation such as deduplication and bot filtering is updated **overnight**. For immediate raw data, use the export option in "Data Governance > Consent Management > Settings".
{% endhint %}
***
## Measurement Approach & Logic
Commanders Act Consent Analysis measures privacy banner interactions based on **visitors or traffic**, not unique users.
### Deduplication (TCPID Cookie)
A 1st party cookie `TCPID` is set to deduplicate actions.
* Commanders Act identifies visitors as new if they delete this cookie.
* The dashboard uses a **last action of the day** logic: only the final interaction recorded during a 24 hour period is kept for calculations.
### Defining Actions
{% tabs %}
{% tab title="Optin actions" %}
An optin action occurs when a visitor:
* Clicks the **Accept** button.
* Saves the Privacy Center with at least one category set to "on".
* Navigates to a second page, clicks an element, or scrolls, only if **Implicit Consent** is enabled in your settings.
{% endtab %}
{% tab title="Optout actions" %}
An optout action occurs when a visitor:
* Clicks the **Reject** button.
* Saves the Privacy Center with all categories set to "off".
{% endtab %}
{% endtabs %}
### Tracking Loss Logic
Tracking Loss is calculated from the same exposed visitor base used in the funnel.
**Denominator:** visitors exposed to the CMP.
Each exposed visitor is classified, using the last action of the day, into one of the following outcomes:
* **Explicit consent**
* **Explicit refusal**
* **No choice**
**Tracking Loss = Explicit refusals + No choice**
This metric estimates the share of exposed traffic for which tracking cannot reliably happen in practice because no usable positive consent outcome is available.
### Ghost Traffic Logic
The platform includes bot detection and filtering for known bots, for example through user agent and technical signature based detection.
In this dashboard, **Ghost Traffic** refers to the remaining visitors exposed to the CMP who generate no interaction with it after this standard bot filtering.
This includes:
* **human bounces**, meaning visitors who land on the page and leave without interacting with the banner,
* **undetectable bots**, meaning bots that use a normal looking user agent and show behavior close enough to human traffic not to be filtered by standard bot detection.
As a result, ghost traffic contributes to the gap between exposed traffic and visitors who actually interact with the CMP.
***
## Scenarios & Detailed Examples
The following scenarios explain how deduplication affects your KPIs:
#### **Example 1: Same day change**
1. A new visitor accepts the privacy banner.
2. Later that same day, they open the Privacy Center and **revoke** their consent.
* **Result:** The dashboard records **1 Opt out** action, the last action, and **1 deduplicated banner view**.
* **Final Metrics:** Opt in rate: 0%, No choice rate: 0%, Opt out rate: 100%.
#### **Example 2: Multi day journey**
1. **Day 1:** A visitor arrives, does not interact with the banner, and leaves.
2. **Day 2:** The visitor returns, accepts the banner, then later revokes it via the Privacy Center.
* **Day 1 Data:** 1 banner view, 100% No Choice.
* **Day 2 Data:** 1 banner view, 100% Opt out, based on the last action.
* **Full Period View:** If you select both days, the metrics will show an **Opt in rate of 0%**, a **No choice rate of 50%**, and an **Opt out rate of 50%**.
***
## Detailed Metric Reference
### Global Metrics
{% hint style="warning" %}
On **23/09/2021** the calculation method was updated to include both banner displays and Privacy Center displays.
{% endhint %}
| Metric | Description |
| --------------------------- | --------------------------------------------------------------------------------------------- |
| **Visitors exposed to CMP** | Number of visitors viewing a CMP banner or Privacy Center. |
| **Give consent** | Visitors who consent to at least one category. Only the last action of the day is kept. |
| **Do not give consent** | Visitors who consent to no category. Includes both explicit rejects and "No Choice" visitors. |
### Consent & Interaction Methods
| Metric | Description |
| ---------------------------------- | ---------------------------------------------------------------------------------------------- |
| **Banner button** | Explicit consent via the "Accept" button on the first layer. |
| **Privacy center** | Explicit consent by saving settings within the Privacy Center. |
| **Implicit (Browse/Click/Scroll)** | Consent triggered by user behavior, if configured. |
| **Interaction rate** | Percentage of visitors exposed to the CMP who clicked any button, link, or the Privacy Center. |
### Engaged Visitors (Explicit Choice)
| Metric | Description |
| -------------------------------------- | ---------------------------------------------------------------------------------- |
| **Visitors making an explicit choice** | Number of visitors who clicked either Accept, Reject, or saved the Privacy Center. |
| **Explicitly consent** | Visitors who made a choice and chose to consent. |
| **Explicitly reject** | Visitors who made a choice and chose to reject. Excludes "No Choice" visitors. |
### Privacy Center Usage
| Metric | Description |
| ----------------------------------- | ------------------------------------------------------------------------ |
| **Exposed to Categories/Vendors** | Number of visitors viewing the category or vendor lists. |
| **Visitors saving a configuration** | Number of visitors clicking the "Save" button in the Privacy Center. |
| **Visitors not saving** | Visitors who opened the Privacy Center but left the site without saving. |
### Reading the Main KPI Cards
| Metric | Description |
| --------------------------- | --------------------------------------------------------------------------------------------------------------------------------------------------------------- |
| **Global Consent Rate** | Percentage of exposed visitors who accepted at least one category. This metric includes all exposed traffic, including bounces and ghost traffic. |
| **Interaction Rate** | Percentage of exposed visitors who generated an interaction with the CMP. |
| **Explicit Consent** | Percentage of positive choices among visitors who interacted with the CMP. This is the most reliable trust and UX performance metric. |
| **Estimated Tracking Loss** | Percentage of exposed visitors for whom no usable positive consent outcome is available in practice. It mainly corresponds to Explicit refusals plus No Choice. |
| **Ghost Traffic** | Exposed visitors with no CMP interaction after standard bot filtering. Includes human bounces and undetectable bots. |
***
## Advanced Understanding
### No Choice vs. Bounce Rate
In an opt in configuration, bounce rate tracking is often impossible because bouncers leave before consenting to analytics. The **No Choice** metric is therefore a useful proxy for part of this reality.
Typical cases include:
* visitors leaving immediately,
* visitors browsing without closing a non blocking banner,
* internal redirects such as language redirects,
* mobile app redirects,
* remaining exposed traffic with no interaction, including human bounces and undetectable bots.
Because of this, **Global Consent Rate** can be affected by traffic quality and bounce behavior. For optimization and interpretation of banner performance, **Explicit Consent** is usually the most reliable metric.
### A/B Testing
Privacy banner performance is critical for data driven marketing. We recommend performing **A/B tests** to reduce **No Choice** and **Opt out** rates where possible. Use the **PRIVACY** filter to compare two banner versions side by side.
A/B testing comparison
---
# Agent Instructions
This documentation is published with GitBook. GitBook is the documentation platform designed so that both humans and AI agents can read, navigate, and reason over technical content effectively. Learn more at gitbook.com.
## Querying This Documentation
If you need additional information that is not directly available in this page, you can query the documentation dynamically by asking a question.
Perform an HTTP GET request on the current page URL with the `ask` query parameter, and the optional `goal` query parameter:
```
GET https://doc.commandersact.com/features/consent-management/user-guides/consent-analysis.md?ask=&goal=
```
`ask` is the immediate question: it should be specific, self-contained, and written in natural language.
`goal` is optional and describes the broader end goal you are ultimately trying to accomplish on behalf of the user. GitBook uses it to tailor the answer towards what is most useful for that goal.
The response will contain a direct answer to the question and relevant excerpts and sources from the documentation.
Use this mechanism when the answer is not explicitly present in the current page, you need clarification or additional context, or you want to retrieve related documentation sections.